Graph traversing with plain RDF/JS objects is no fun. Keeping track of the path walked while traversing a graph adds another layer of complexity. With Grapoi, graph traversing is fun again and makes code more readable.
You may have read my older blog post describing how I implemented a 15x faster JavaScript SHACL engine. That library also introduced a sub-graph coverage report feature. To make the code for that feature more readable, I implemented a traversing library that keeps track of the traversing history. It was only briefly mentioned in the old blog post, but now it’s time to have a detailed look at the traversing library.
First, some basics: It requires having the term/node, name graph, and the dataset to keep a reference when dealing with RDF data. I use the following data structure in multiple of my RDF/JS libraries, and I call it graph pointer:
1 | { |
Where term and graph are Term objects and dataset is a DatasetCore object. It’s possible for term and graph to have a nullable value, which means any term or any named graph.
While the data structure fulfills one of the ideas of RDF/JS CG specifications of having minimalistic interfaces, it also shows the need for a high-level library. Nobody wants to write code like this:
1 | const ptr = { |
That is where Grapoi comes in. It is inspired by Gremlin and allows you to implement the previous logic with the following line:
1 | const ptr = otherPtr.out(ns.schema.name) |
But Grapoi extends the idea of the graph pointer in two dimensions.
List of Pointers
Many times, it’s not a single graph pointer that needs to be traversed with a given set of instructions but multiple graph pointers. That could be either initially given or returned by a traversing step. That’s why Grapoi handles a list of pointers. Traversing instructions are processed for each pointer, and a new list of graph pointers is used with the results added in order.
The following example uses the House M.D. dataset. It starts with two graph pointers with literal terms. Then, it traverses from object to subject over the predicate givenName. After that, the traversing continues in subject to object direction over nationality and name.
1 | grapoi({ |
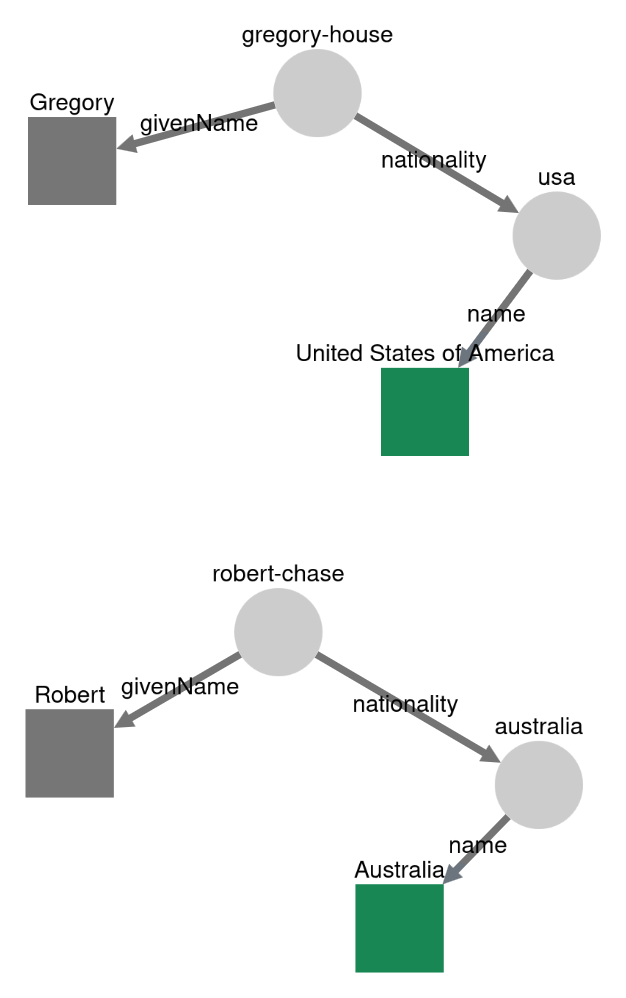
The result will be a list of pointers with the literals USA and Australia in that order.
A Grapoi object can be a single graph pointer or a list of them. If all the terms are the same, .term property is set. Otherwise, it’s undefined. The full list of terms is always available with the .terms property as an array.
Pointers with the same term may show up multiple times. The .distinct() method reduces the list to a unique set of terms. The .distinct() method also compares graph and dataset in case the pointers refer across named graphs or even datasets.
Path
A path or the traversing history is the other dimension Grapoi adds. A path can be, in the simplest case, just one-dimensional, referring to a term. But it can also be an ordered list of edges. An edge is a quad with a start and an end. The start and end are strings pointing to the property of the quad. A traverse step from subject to object would look like this:
1 | { |
Every traversing step appends the new edge to the end of the list. A path also implements the graph pointer interface, with the end of the last edge as the term.
Grapoi
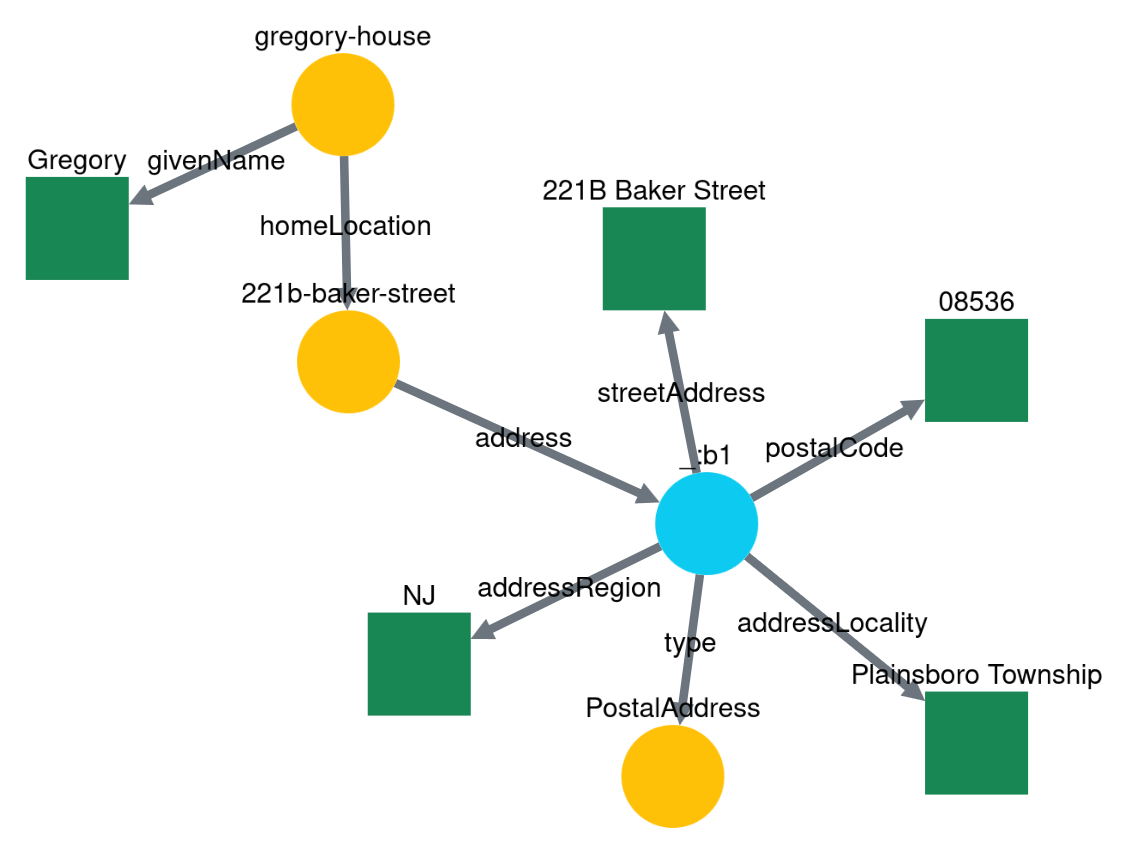
Grapoi combines the two dimensions. It handles a list of paths. After each traversing step, a new object with a new list of paths is created, with the new edges appended. If there are multiple results for a traversing step, paths for each result are added to the list. There is an iterator to loop over all quads of the whole traversing history. That can be used to generate coverage sub-graphs. Below is an example similar to the earlier one with the required changes:
1 | rdf.dataset( |
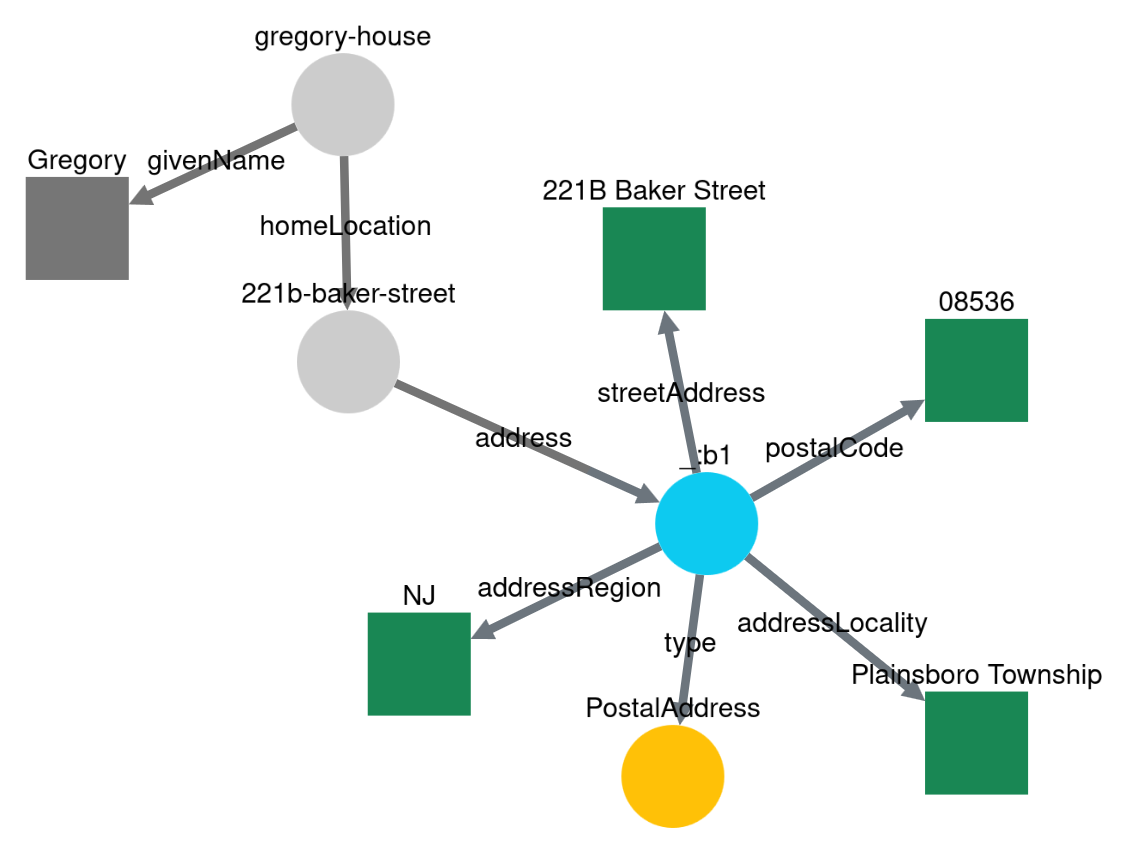
It’s also possible to first traverse to one or more specific points and start the traversing history from those points. The example below traverses to the address, trims the paths, follows all address properties, and then the quads are added to the dataset. Only the address quads will be in the dataset.
1 | rdf.dataset( |
More
There are some other features that could be mentioned. These are saved for further blog posts, like the Processor that takes care of the traversing and supports not only single-step traversing but also zero or more.
Documentation and Examples
The API documentation is on the RDF-Ext homepage. If you want to try it yourself, the rdf-ext examples repository contains multiple examples as a starting point. You can do that in your browser with Gitpod. Check the tutorial page on the RDF-Ext homepage.
Clownface
You may have used Clownface before and noticed some similarities. I developed Clownface some years ago. But now I strongly recommend switching to Grapoi, not only because of its superior feature set but also because I no longer maintain Clownface.
Comments
For comments, please follow the GitHub link.